Statistics 1 Dersi 2. Ünite Özet
Collecting And Organizing Data
Introduction
One of the most important steps of statistical investigation is the collecting of data. The collection of data is a laborious and lengthy process in which researchers must be careful. To achieve the facts of interest in a research, it is important to obtain data from the appropriate source of data and measure variables correctly.
Data Sets
Statistical analysis requires that the factual information of interest in a research be collected and organized in a useful manner. Such facts are described as data. A data set is a collection of facts aggregated for a specific purpose.
Element: A data set provides facts about a collection of elements and includes, for each element, information one or more characteristics of interest. Elements are the entities on which the data are collected.
Variable: A variable is a characteristic of interest about an element. This characteristic takes on different values for different elements. Age is a variable and takes on different values for different workers. Age is a quantitative variable because it takes on numerical measurements.
A characteristic that can take on different possible outcomes is called a variable. The variable is defined as quantitative if the outcomes are numbers and qualitative if the outcomes are nonnumeric qualities or attributes.
Case: The outcomes obtained on all variables for one element in the data set is called a case.
Observation: The outcome about a single variable for an element in the data set is called an observation.
Measuring Variables
From a statistical point of view, measurement is the assignment of numerals to variables about objects or events according to rules.
Nominal Scale
Nominal scales of measurement classify things or individuals into qualitatively different classes. The variable Gender has two categories, female and male. Thus, researches could describe sex of the workers using a nominal scale by categorizing people as female and male.
Ordinal Scale
Ordinal scales of measurement have the property of both classifying and magnitude. Subjects are categorized into different rank ordered groups. Each value on the ordinal scale has a unique meaning, and it has an ordered relationship to every other value on the scale.
Interval Scale
Interval scales of measurement have the properties of classifying, magnitude, and equal intervals. While the ordinal scales of measurement show that individuals have more or less something than the others, interval scales have more precise information indicating how much of something individuals have.
Ratio Scale
Ratio scales of measurement, in addition to having all properties of the interval scale, have a natural or zerovalued base value that cannot be changed. For example, an individual’s age, weight, height, systolic blood pressure are ratio scale variables because they have natural base value. For example, John and Mary are 20 and 40 years old, respectively. We can say that Mary is two times older than John.
Data Sources
The first step is to identify the problem to be studied for a research. What are the effects of age, gender, and educational degree on the annual income? In this example, age, gender and educational degree are the independent variables and annual income is the variable of interest or dependent variable.
We can obtain some data from an internal data source, such as an organization’s operating and accounting records. These routine data are usually saved in computer data files or databases for efficient entry, storage, and retrieval of information. Internal data is obtained from inside the company for successful operations.
We usually obtain data from external data sources. External data sources may be a reference book or statistical periodical published by a government agency, a trade association, or a private service company. Today, external data sources are the online databases.
Observational Studies: In an observational study, researchers simply collect data based on what is seen and heard and infer based on the data collected. Researchers observe subjects and measure variables of interest without any intervention to the subjects.
Experimental Studies: Experimental study is a study in which the researcher manipulates some of the variables and try to determine how the manipulation influences other variables. In an experimental study, one or more independent variables are controlled so as to obtain information about their influence on the dependent variable. However, researchers cannot control all the variables having effects on the dependent variable.
Data Collection Methods
Observation, interview, and self-enumeration are the commonly used methods for data acquiring.
Observation Method
Observation is making direct examination and taking measurements of an ongoing activity. In other words, observation is way of obtaining data by watching behaviour, events, or noting physical characteristics in their natural setting. Example, A researcher recorded the observed daily closing prices of several publicly traded common stocks for a financial study. The advantages are:
- The direct recording of the data avoids problems such as incomplete or distorted recall.
- Data can be obtained continuously over an extended period of time.
The limitations are:
- The observer or the instrument to be used for data gathering must be able to record the events correctly. For example, human observers must get through training about the study and the data to be collected and so that different observers will record the same events in the same manner.
- The individuals included in the study might be aware of this fact and then altered their behaviour, decision or answers. This leads to bias in the study.
Interview Method
One of the most common methods of collecting data from individuals is interviewing. In an interview procedure, a researcher or observer asks the questions from a questionnaire and records the individual’s answers. Data collection by interview can be conducted in many ways, for example, by telephone or via face-to-face interview. The advantages of the data collection by interview are:
- People will tend to give answers to the question when they are approached in person or by telephone, so the data collection by interview usually includes usable information from those people who are conducted.
- Direct contact with the responders avoids misunderstanding of the questions.
On the other hand, the limitations of the interviewing method are:
- If the questioner does not obey the rules for selecting individuals or may select an irrelevant individual about the study, this leads to bias into the results.
- The questioner may affect the individuals’ opinion about a question and this leads to get incorrect answers.
- The questioner may make recording errors.
Self-Enumeration Method
In a self-enumeration method, individuals answer the questions printed on a questionnaire paper, or displayed on a computer monitor. In other words, self-enumeration method refers to the completion of survey questionnaires by the respondents themselves. Example, A university student who successfully completed the course filled out the assessment questionnaire about the lecturer.
Questionnaire Design
In a questionnaire design, different types of questions can be used, such as open-ended, closed-ended, single or multiple responses, ranking, and rating.
Open-Ended and Closed-Ended Questions: Open-ended questions allow individuals to give a free-form answer. However, closed-ended questions can be answered with “Yes” or “No,” or they have a limited set of possible answers such as “A”, “B”, “C”, or “all of them”. In many surveys, closed-ended questions are preferred because close-ended questions lead to obtain higher response rates when responders don’t have to type so much.
Single or Multiple Responses: In designing questions, it is important to make sure whether a respondent to give a single or a multiple response. Unlike the question that requires multiple response, the question that requires single response must include mutually exclusive options.
Ranked Responses: Some questions in a questionnaire ask the respondent to rank a set of options by numbering them in an ascending or descending order.
Rated Responses: Rated responses generally include threepoint, five-point, and seven-point scales. A rating scale should provide more than two options. The mostly used rating scale is five-point Likert (1932) type scale.
Question Order: Once the survey questions are developed, the questions should be assembled in a proper order. The initial questions should establish rapport with the respondent and should be simple to answer.
Clarity of Question Wording: The choice of words in a question is critical in expressing the meaning because a question must ensure that all respondents interpret the question approximately the same way.
Pretesting: A pre-test is conducted using small sample of the survey population. Pretesting finds out the unpredictable difficulties in the layout of the questionnaire and in the clarity of wording.
Common Errors While Collecting Data
Error in Population Specification: Error in population specification occurs when the researcher determines an inappropriate population from which to collect data.
Error in Sampling: A sample must be representative of the population. Sampling methods must be used to achieve a representative sampling. Otherwise, the sampling does not represent the targeted population and the results yield biased or inaccurate information.
Error in Measurement: Error in measurement can be described as any discrepancy between the actual result obtained and the correct result that would be provided by an ideal procedure. From a statistical point of view any observation is composed of the true value plus some random error value. Random errors are caused by unknown and unpredictable factors that randomly affect measurement of the variable across the sample. Systematic errors are reproducible inaccuracies that shift measurements from their true value by the same amount and consistently in the same direction.
Organizing Data
Raw Data
Raw data or primary data, which are collected directly related to their object of study, are the original measured values or scores, without any manipulation, except perhaps sorting in the case of quantitative data. Arranging the raw data in increasing or decreasing order of magnitude is a simple way providing inspection of the data
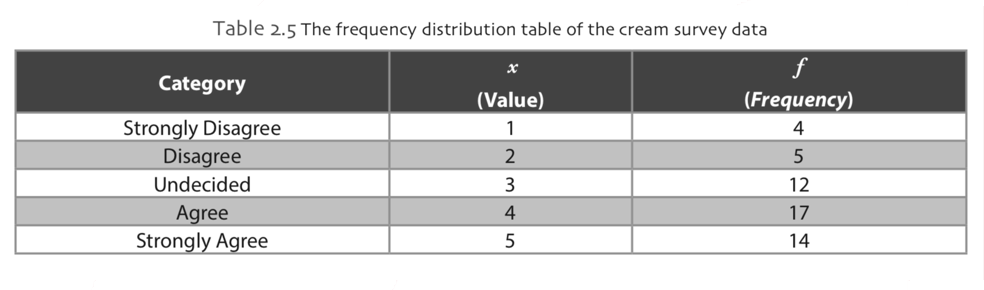
Frequency Distribution Tables
To construct a frequency distribution table, the measurement categories and the number of responses within a given measurement category are used. To construct the frequency distribution table for data, we need to know the frequency count for each category.
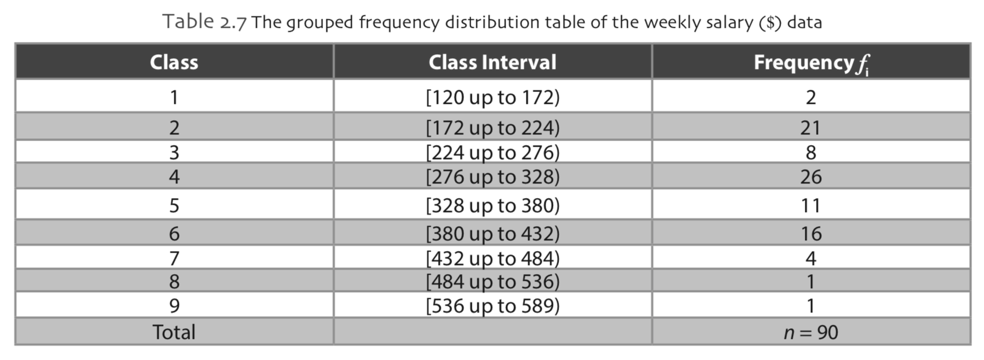
Grouped Frequency Distribution Table
When the data set is large, or the measurements are obtained using ratio scale, grouped frequency is more appropriate for summarizing the data. Grouped frequency distribution table consists of classes and the number of elements in these classes. The classes must be mutually exclusive and exhaustive. The first step in constructing the grouped frequency distribution table is to determine the number of classes. The number of classes can be easily determined by taking the square root of the number of objects, n. The class width can be obtained using the following formula.
where range is the difference between the maximum and the minimum of measurements. After the division, we may round the resulting number to convenient unit. The first interval contains the minimum measurement. The class intervals must be arranged in a way that no measurement falls on a point division between two class intervals. The next step is to calculate the number (frequency) of elements falling into each class.
Relative Frequency Distribution Table
Percentage representation of frequency can also be displayed in the frequency distribution table. Percentage of frequency is called the relative frequency and the table is called relative frequency distribution table. The relative frequency for a class is calculated as follows. The relative frequency for a class is calculated as follows.
where, fi is the frequency for class i and n is the sample size.
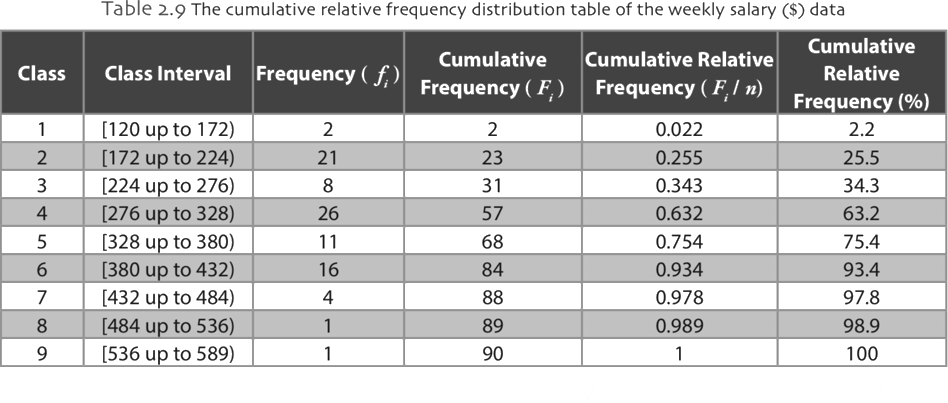
Cumulative Frequency Distribution Table
A frequency distribution table provides information of how many observation or elements occurred for each value or group of values of a variable. Cumulative frequency is used to determine the number of elements that falls above or below a particular value in a given class interval. The cumulative frequency of a class is calculated by adding its frequency to the sum of all predecessor class frequencies.
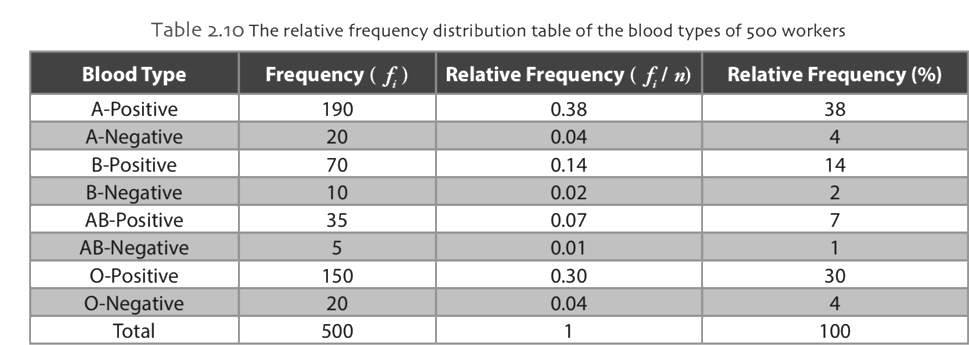
Organizing Categorical Data
Categorical or qualitative data can usually be obtained using nominal or ordinal sales. On the other hand, sometimes quantitative data can be transformed into qualitative data by grouping or categorizing the quantitative data. A frequency table or relative frequency table can be used in organizing categorical data.
Contingency Tables
If a data set includes two different categorical variables, we use a two-way table (contingency table) to demonstrate the relationship and interaction of the two categorical variables. A contingency table is a special type of frequency distribution table, where two variables are shown simultaneously, and it is used to determine if one categorical variable is related to another categorical variable. Also, relative frequencies or percentages can be demonstrated in a contingency table.
-
Çıkmış Soruları Gönder Para Kazan!
date_range 2 Temmuz 2026 Perşembe comment 25 visibility 4664
-
2025-2026 Öğretim Yılı Yaz Okulu Kayıt Duyurusu
date_range 29 Haziran 2026 Pazartesi comment 4 visibility 977
-
2025-2026 Öğretim Yılı Bahar Dönemi Dönem Sonu (Final) Sınavı Sonuçları Açıklandı!
date_range 18 Mayıs 2026 Pazartesi comment 1 visibility 3155
-
AÖF 2025-2026 Öğretim Yılı Bahar Dönemi Dönem Sonu Sınavı sorularına itiraz
date_range 12 Mayıs 2026 Salı comment 1 visibility 1354
-
2025-2026 Bahar Dönemi Dönem Sonu (Final) Sınavı Sınav Bilgilendirmesi
date_range 4 Mayıs 2026 Pazartesi comment 2 visibility 3293
-
Başarı notu nedir, nasıl hesaplanıyor? Görüntüleme : 28037
-
Bütünleme sınavı neden yapılmamaktadır? Görüntüleme : 16403
-
Harf notlarının anlamları nedir? Görüntüleme : 14808
-
Akademik durum neyi ifade ediyor? Görüntüleme : 13935
-
Akademik yetersizlik uyarısı ne anlama gelmektedir? Görüntüleme : 11855