Statistics 1 Dersi 1. Ünite Özet
Introduction To Statistics
Introduction
The principal reason why Statistics is a key necessity to humankind today is the explosion of available information, mainly in the form of numerical data, and massive amounts of it. Well then, is Statistics a science, or is it just a service to support other people’s projects, research and marketing strategies? Perhaps it is the science on which humanity depends, since our whole existence is determined by statistical principles.
Statistics in Daily Life
Climate is a theme that concerns us every single day - we talk about it all the time and constantly check the weather forecasts. Statistics is at the heart of understanding climate patterns and making weather forecasts. One of the most successful displays of quantitative weather forecasting is by the Norwegian meteorological office www.yr.no, for example the weather for Eskişehir 30 May - 1 June 2018.
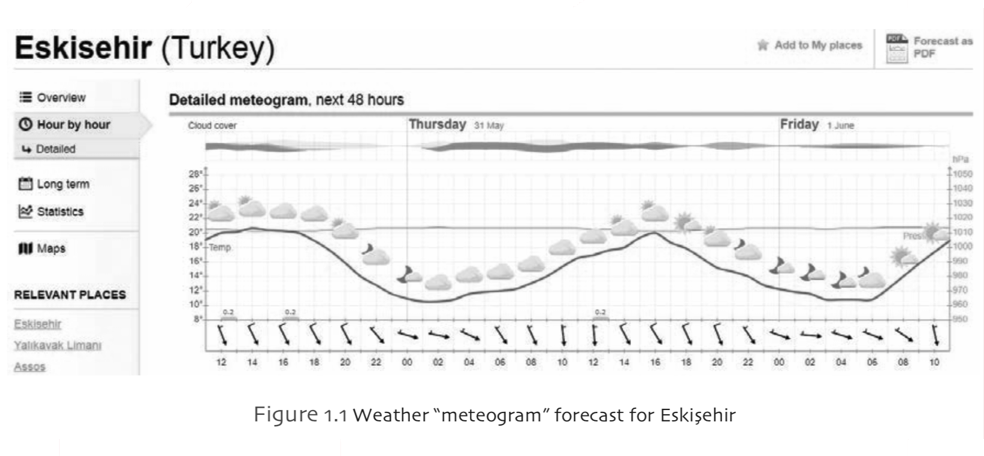
This example of what is called “information graphics” is a beautiful example of design that conveys a lot of statistical information. This graph is showing many different weather indicators at the same time: the temperature (red), pressure (green), rainfall (small blue bars), wind direction (arrows), wind speed (little “whiskers” on the arrows) and cloud cover (thickness of the gray bar at the top). In addition, a small icon is given for every two hours summarizing the weather.
Data, Population and Sample
Data are just about everywhere in our daily lives, and never before have so much data been recorded and analysed. Can you imagine how much data about yourself is being stored in different places? Your grades at school and at university, your medical records, your purchases, your income, your insurance history, your emails, your posts on social media and your behaviour on the web, for example which web sites you visit and how long you spend on each one of them. Data come in the form of numbers as well as text, which is something we are discovering more and more.
For example, it is impossible to ask the whole population of Turkey what their view on climate change is, whether they believe it is natural or manmade. This is where the most basic concept in Statistics comes into play: sampling from a population. The population in this case would be the total population of 81,815,367 people in Turkey (according to the website http://www.worldometers.info/world-population/turkeypopulation/ when consulted on 30 May 2018), excluding about 25% of the population 14 years and younger, let’s say approximately 60 million people. A reasonable survey would ask a sample of about 1000 carefully selected people the question about climate change and ignore the opinions of the other 59,999,000 people!
The way the sample is collected is crucial to obtaining a valid estimate, and this is an important subject which will be dealt with in this course. The main criteria for selecting a sample will be that the sample is representative of the population and that there is no or very little subjectivity in the choice of the sampling units. Sampling is not only conducted by survey researchers on human populations, but also by auditors on a company’s accounts, by agricultural researchers on different pieces of land, and by quality control inspectors on products in a factory, to name only a few examples.
Measurement Scales
Data come in various forms and are measured in different ways. Blood pressure, question response, country, age, income, course grade, number of supermarket visits and purchased products, these are all statistical variables. The observations made on these variables constitute the data.
The easiest form of data is called categorical, or qualitative, for example data on variables “country” (e.g., the data observation might be Germany) or “question response” (e.g., believe that climate change is manmade) or “exam grade” (e.g., B). Categorical variables and data can be either nominal or ordinal. The question about climate change, with possible responses “natural”, “manmade” or “don’t know/can’t answer” is a nominal categorical variable, as is the variable “country” - there is no ordering in the categories of these variables. By contrast, exam grade is an ordinal categorical variable, since its categories are ordered: A is better than a B, B is better than a C, and so on. Other examples of nominal categorical variables are gender, region of residence, field of study, type of transport, type of housing, etc. Other examples of ordinal categorical variables are income group (if incomes have been categorized), an attitude question in a survey where possible responses are strongly agree/agree/disagree/strongly disagree (these categories have an order), social class (with classes usually in an inherent order), terrorist threat levels (in the UK these are low/moderate/substantial/severe/critical), etc.
The other main type of data (see Fig. 1.4) is called continuous, or quantitative, for example data on variables “blood pressure”, “age” and “income”. These are observations of variables on continuous scales, usually rounded in some convenient way. For example, although age is a continuous time variable, and we are getting older all the time by seconds, minutes and hours, someone’s age is almost always rounded to the number of years completed.
Other measures of time are interval-scale variables (the word “interval” gives you a clue to that!), for example hours of sleep (on Sundays I sleep an hour longer - I would not say I sleep 14% longer) and time to run 100 meters (e.g., at the 2009 World Championships in Berlin, Usain Bolt shaved more than a tenth of a second off his record, clocking 9.58 seconds - we wouldn’t say he reduced the time from 9.69 seconds by 1.1%).
Finally, the world today abounds in textual data. Words, SMSs, tweets, social media posts, verbal responses in questionnaires, these can all be treated as data. Some recoding will be necessary, since text is not numerical. Frequently occurring words can be counted, the lengths of sentences can be measured, the number of words used just once can be identified, and so on, in order to create quantitative variables from text. Textual data have been used, for example, in identifying the author of threatening letters, in comparing political party manifestos, in classifying respondents in a survey who give answers to open- ended questions.
Types of Statistical Investigation
There are differences in study objectives which are important to recognize. The main distinguishing factor is whether the study aims to find some evidence of a result or whether it aims to find causes of a result. Medical research is a good context to understand these differences - Statistics in medical research is often called Biostatistics.
In order to be able to prove that aspirin is the cause of the improvement in health, an experiment needs to be conducted where conditions are controlled between those taking aspirin and those not taking it. Such an experiment might be designed as follows, restricted to men, for example, since the effects are suspected to be different for men and women. Suppose we take a large group of men in the age group 60- 70 years of age that have no history of chronic disease. We divide them into two groups so that the groups are “balanced” in terms of known factors such as age, social class, and so on (we don’t want one group to have older men than the other).
So how was it determined that smoking causes lung cancer? Was there an experiment where there were two groups of people, one told to smoke and the other not? This might be possible for mice in a laboratory (i.e., exposing one group to smoke, the other not) but certainly not for people! The certainty that smoking caused cancer was the result of a very many observational studies that consistently showed that cancer was associated with smoking. There was eventually so much evidence from observational studies that it was finally recognized that smoking was the cause - if you are interested in this historic decision, there is an excellent article online (http://tobaccocontrol.bmj.com/ content/21/2/87).
Almost all of statistical research is based on observational studies, and only in special cases are experiments conducted. An area where experimentation is of crucial importance is in pharmaceutical research.
Another popular area for experimentation is in economics, where people are divided into groups, given some money (real or fake) and confronted with different decisions to make in different scenarios (these are the treatments). Comparing the way, the groups act leads to understanding the psychological aspects of economic behaviour. This area of economics, known as game theory, has led to many Nobel prizes, the most well-known being that of John Nash, which was made into the film A Beautiful Mind (2001).
The Era of Data Science and “Big Data”
The word Statistics is considered by some people, especially businessmen, as a bit old-fashioned, and sometimes even difficult to pronounce! But don’t be fooled: Analytics is a fancy word for Statistics.
When it comes to Data Science, however, the term does have some different meaning. Data Science is a field that includes Statistics as well as areas such as Computer Science, Database Management and Data Visualization, for example, and has come into being mainly as a result of the spectacular growth in the amount of available data in this new information world that we live in. The need has been recognized for someone who not only has statistical skills, but also advanced programming skills and knowledge about handling huge data sets, the so-called “Big Data” of today.
What are the “big data” sets today and where do they come from? These are mostly found in the following areas:
- Commerce, especially online electronic commerce
- Finance, for example share prices on stock markets, all managed electronically
- Insurance, all the premiums, incidents, actuarial transactions in an insurance company
- Biomedicine, especially in genetics, where information is literally exploding as genesequencing reveals and codes the total genetic profile of a person
- Transport, for example in the airline industry, all the flights, all the passengers
- Climate data, measurements from tens of thousands of weather stations across the world
To take one example, that of purchasing a product online from a major company such as Amazon. Once you are in this system, your information and purchasing behaviour is included in a complex statistical system (often referred to as “the algorithm”) to recommend to you other products that you are probably interested in.
We are living in such a world today, where big data are being stored and processed and analysed, and all of this mostly relies on Statistics to provide the answers. Statistics is a very interesting subject!
-
Çıkmış Soruları Gönder Para Kazan!
date_range 2 Temmuz 2026 Perşembe comment 25 visibility 4665
-
2025-2026 Öğretim Yılı Yaz Okulu Kayıt Duyurusu
date_range 29 Haziran 2026 Pazartesi comment 4 visibility 977
-
2025-2026 Öğretim Yılı Bahar Dönemi Dönem Sonu (Final) Sınavı Sonuçları Açıklandı!
date_range 18 Mayıs 2026 Pazartesi comment 1 visibility 3157
-
AÖF 2025-2026 Öğretim Yılı Bahar Dönemi Dönem Sonu Sınavı sorularına itiraz
date_range 12 Mayıs 2026 Salı comment 1 visibility 1357
-
2025-2026 Bahar Dönemi Dönem Sonu (Final) Sınavı Sınav Bilgilendirmesi
date_range 4 Mayıs 2026 Pazartesi comment 2 visibility 3295
-
Başarı notu nedir, nasıl hesaplanıyor? Görüntüleme : 28037
-
Bütünleme sınavı neden yapılmamaktadır? Görüntüleme : 16404
-
Harf notlarının anlamları nedir? Görüntüleme : 14809
-
Akademik durum neyi ifade ediyor? Görüntüleme : 13935
-
Akademik yetersizlik uyarısı ne anlama gelmektedir? Görüntüleme : 11855